Here we show the design and production method for an ultra-steep notch filter. This notch filter, constructed without thin layers, is optimized using a constrained optimization technique, making it highly suitable for precise monitoring via the electron beam deposition technique. Single-layer SiO₂ and Ta₂O₅ films were deposited and meticulously characterized to determine tooling factors and accurately assess refractive index wavelength dependencies. The ultra-steep notch filter was produced using an indirect monochromatic monitoring strategy, achieving excellent alignment with the theoretical spectral performance.
1. Introduction
Notch filters are optical filters designed to selectively block a specific wavelength band while allowing transmission at both shorter and longer wavelengths. These filters have a range of scientific and technological applications, such as laser radiation protection, laser-based fluorescence instrumentation, Raman spectroscopy, and more.
Rugate filters, which utilize continuously modulated refractive indices, present a promising approach to designing notch filters. These filters offer significant optical performance advantages, including broad passbands and the elimination of ripple effects through apodization. Although the theoretical foundation and exceptional spectral properties of rugate filters are well understood, achieving precise reproduction of gradient-index filters remains a significant challenge.
A simpler method for designing notch filters involves two-material multilayers. Researchers have developed various methods to enhance the performance of these filters, including approaches with equivalent layers that enable high-performance two-material notch filters. However, two-material designs often require extremely thin layers, which are difficult to control accurately. Furthermore, such filters are typically produced by ion beam sputtering, a process that can be time-consuming and results in high-stress layers.
Ion-assisted electron-beam deposition is one of the most widely used technologies for coating production, offering benefits such as a high deposition rate and low-stress film quality. To fabricate notch filters effectively using this deposition technique, it is essential to consider layer thickness constraints, as precise control of the refractive index and layer thickness is improved when layers are neither too thin nor too thick.
In this tutorial, we present a design and production approach for an ultra-steep notch filter. This notch filter, with layer thicknesses close to the half-wave of the rejection wavelength, is optimized through a constrained optimization technique, making it highly suitable for precise monitoring during deposition. Single-layer SiO₂ and Ta₂O₅ films were deposited and characterized to accurately determine tooling factors and the wavelength dependencies of refractive indices. Using ion-assisted electron-beam deposition and an indirect monochromatic monitoring strategy, we successfully produced the ultra-steep notch filter, achieving excellent alignment with theoretical spectral performance. Additionally, we conducted reverse engineering on the deposited filter to identify remaining deviations from the target curve, which were primarily associated with the low-index layers.
2. Design of the Ultra-Steep Notch Filter
The design of the notch filter aims to meet specific performance criteria under normal incidence: high transmittance (excluding any backside reflections) within the wavelength ranges of 400-500 nm and 550-700 nm, and high reflectivity in the spectral region from 500 to 550 nm. These requirements are illustrated by the purple dots in Fig. 1.

We introduced a design approach for notch filters featuring layer thicknesses around half the rejection wavelength. Designing filters without extremely thin layers is advantageous due to practical layer thickness constraints in coating production. Conventional deposition processes often have proven lower thickness limits, and such limits are especially relevant when considering monitoring strategies. For non-quarter-wave multilayers, level monitoring is frequently applied. To minimize thickness error, active monochromatic monitoring strategies require at least one extremum in the monitoring signal during layer deposition, achievable only if each layer is sufficiently thick.
Upper limits on individual layer thicknesses may also be beneficial. Excessively thick layers can result in structural changes within the film and unreasonably high total optical thickness values, which the constraints help to prevent.
In this work, we applied the constrained optimization method to design the notch filter, setting lower and upper optical thickness constraints for layers at 100 and 350 nm. Using OptiLayer software, the final design’s layer thickness profile and spectral response are shown in Fig. 1. The design achieves an average transmittance above 99%, with transmission zone bandwidths of 30 nm at -30 dB and 52 nm at -0.5 dB attenuation. Steepness is quantified by the ratio of these bandwidth values. Compared to notch filter designs using the apodization technique from [12], additional optimization of layers near the substrate further suppresses passband ripple. Nevertheless, the main structure remains an apodized multilayer stack. As expected, all layers in this design have optical thicknesses close to half the central rejection wavelength, supporting accurate monitoring during deposition. This coating can be effectively produced using ion-assisted electron-beam deposition, offering a high deposition rate and good stress quality.
3. Deposition and Characterization of Single Layers
For the coating production, we utilized the Optorun Electron-beam deposition system. During deposition, an RF-type ion source was used to densify the layers, resulting in stable coatings without significant shift after cooling and venting. The deposition temperature was set to 473 K, with deposition rates of 0.2 nm/s for Ta₂O₅ and 0.6 nm/s for SiO₂. To control layer thicknesses, we employed an indirect monochromatic back-reflection optical monitor. Preliminary calibration was conducted through pre-production depositions of single Ta₂O₅ and SiO₂ layers to precisely determine tooling factors and refractive index wavelength dependencies.
We deposited SiO₂ films with a thickness of approximately 440 nm and Ta₂O₅ films around 300 nm. Each material was deposited onto two samples: one on monitor glass and the other on the calotte. Both sample pairs were monitored at 750 nm, a wavelength frequently used in our monitoring procedure for notch filters. Depositions of both materials were terminated at a swing level of 50%, with the monitoring signals displaying two minima and two maxima prior to completion.
After deposition, the spectral responses of the samples were measured with a Cary5000 spectrophotometer. Refractive indices and thicknesses were derived using OptiChar characterization software and validated against established data for thin films of the same materials. Film thicknesses on the test glasses were determined based on the swing level, with these thickness ratios defining tooling factors.
Figure 2 presents the measured transmittance for Ta₂O₅ films alongside the transmittance of the uncoated substrate. The alignment of all maxima with the uncoated substrate’s transmittance indicates film homogeneity. Deviations are within 0.1%-0.2%, well within the estimated accuracy of transmittance measurements, validating the use of homogeneous film models for measurement data processing.

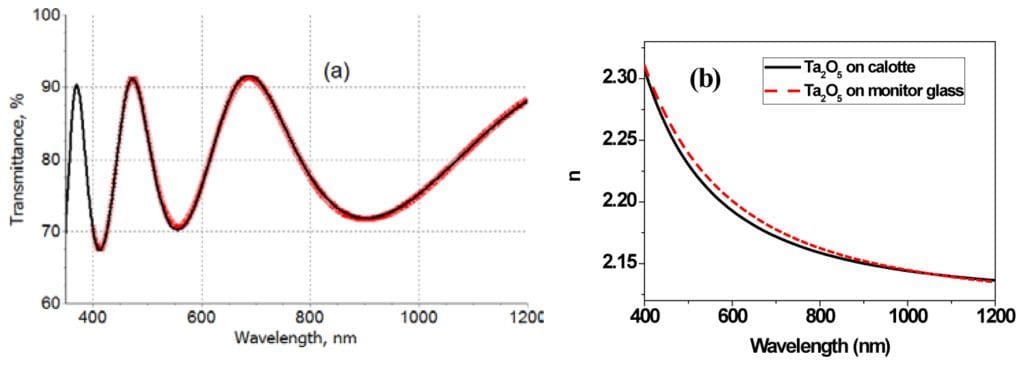
The model transmittance curve fitted to the measurement data is shown in Fig. 3(a), and the derived wavelength-dependent refractive index values are depicted in Fig. 3(b). The refractive index values for Ta₂O₅ on both the monitor glass and the calotte substrate exhibit excellent correspondence, allowing us to disregard any minor offsets in refractive indices and focus solely on layer thickness errors.
Additionally, the measured thickness of the Ta₂O₅ film on monitor glass aligns closely with the planned value: the measured thickness is 3.55 quarter wave optical thickness (QWOT) at 750 nm, compared to the planned 3.54 QWOT for a 50% swing level. The film thickness on the calotte measures at 3.64 QWOT, indicating that the monitor film is slightly thinner with a tooling factor of 0.975.

Reflectance and Refractive Index Analysis of SiO₂ Film
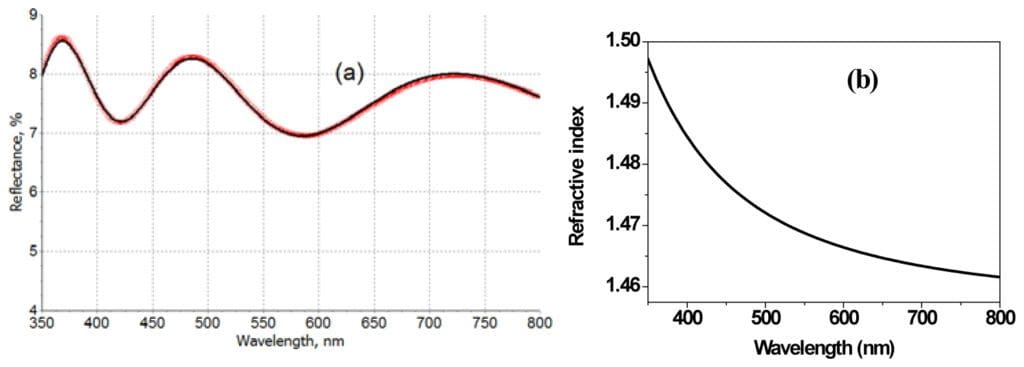
Figure 4(a) shows the fit of the measured reflectance data (gray crosses) to the model reflectance curve (solid line) at the end of the discrepancy function minimization for the SiO₂ film. The wavelength-dependent refractive index of the SiO₂ film is depicted in Fig. 4(b). Reflectance data for the SiO₂ film on monitor glass is unavailable, as the deposition area on the monitor glass was too small for reflectance measurements. However, the refractive index of the film on the calotte was accurately derived from reflectance data.
Using this fixed refractive index, we determined the film thicknesses on both the calotte and monitor glass based on transmittance data shown in Fig. 5. The thicknesses were found to be 3.88 quarter wave optical thickness (QWOT) on the calotte and 3.56 QWOT on the monitor glass, resulting in a tooling factor of 0.917.


4. Fabrication of the Notch Filter
For this experiment, we used the indirect monochromatic monitoring with level monitoring. Specifically, the Optorun monochromatic back-reflection monitor was employed to produce the notch filter. This monitoring strategy utilizes one monitoring chip to control the thicknesses of two subsequent high- and low-index layers (starting from the second layer onward). Using multiple monitoring chips rather than a single chip helps prevent cumulative errors in determining the precise termination points for each layer’s deposition.
We selected an optimized sequence of monitoring wavelengths for all monitoring chips to improve the accuracy of termination registration. The selected monitoring wavelength for each layer ensures that the monitoring signal passes at least one extremum and that the difference between the termination level and the last registered extremum falls within 20%-80% of the difference between previous extrema. This range ensures the reflectance is highly sensitive to thickness variations of the deposited layer. The ratio between these two differences is known as the swing, typically expressed as a percentage.
The notch filter was fabricated using the tooling factors and refractive indices previously derived. After deposition, the sample’s transmittance was measured at normal incidence across the spectral range of 400 nm to 800 nm with a Cary5000 spectrophotometer. Figure 6(a) presents a comparison of the measured transmittance data with the theoretical transmittance data, demonstrating an excellent match between theoretical and experimental results.

Although the notch filter achieved excellent performance, some deviations remain between the experimental and theoretical transmittance data. These deviations stem from minor errors in layer parameters. In this experiment, we used a stable deposition process that yields high-density films, and the refractive indices of the deposited Ta₂O₅ and SiO₂ thin films are stable and known with high accuracy. This stability allows us to disregard minor offsets in refractive indices and attribute the observed deviations solely to thickness errors in the layers.
In our monitoring strategy, each chip controls two successive layers—one high-index and one low-index—and layer depositions are terminated based on theoretically predicted swing levels. Theoretically, this strategy ensures accurate control of the first high-index layers, even when minor signal drifts are present. However, the same level of control cannot be guaranteed for the low-index layers, which are the second layers in the monitored pairs.
Figure 7 shows a comparison between experimental monitoring curves and theoretical light values, displaying strong correspondence for high-index materials but some discrepancies for low-index materials. This suggests that the deviations observed in Fig. 6(a) are likely due to thickness errors in the low-index layers.

We conducted reverse engineering on the deposited notch filter sample using OptiRE software, based on the assumption that deviations were due to random thickness errors in the low-index layers. Figure 6(b) illustrates the fit of the measured notch filter transmittance to the model transmittance when random thickness errors in the low-index layers were introduced. The resulting errors were all within 3.5% of the planned theoretical layer thicknesses. This close alignment with the measured data confirms that the deviations observed in Fig. 6(a) can indeed be attributed to errors in the low-index layers.
5. Conclusion
In conclusion, we successfully designed ultra-steep notch filters using constrained optimization with specified lower and upper limits for layer thicknesses. The filter was produced using an indirect monochromatic monitoring strategy alongside conventional deposition technology, and experimental results show excellent agreement with the theoretical spectral performance. Additionally, reverse engineering confirmed that the monitoring procedure effectively controls the high-index layers, with remaining deviations from the target curve attributed to errors in the low-index layers. In future studies, we plan to enhance our design-monitoring-production process by improving the monitoring accuracy of low-index layers.
