When optical designers analyze and compare the performance of optical systems, one of the most widely used metrics is the modulation transfer function (MTF). This measurement is versatile, applicable to everything from simple single-element lenses to advanced multi-element telecentric lens assemblies. To understand why MTF is crucial, let’s explore its key components—resolution and contrast—alongside its broader importance and practical characterization methods.
UNDERSTANDING THE COMPONENTS OF MTF
Resolution
Resolution describes the ability of an optical system to distinguish fine details in an object. It is typically expressed as line-pairs per millimeter (lp/mm), where each pair consists of one black line and one white line. This value, also known as spatial frequency, can be inverted to calculate the spacing between resolved lines.
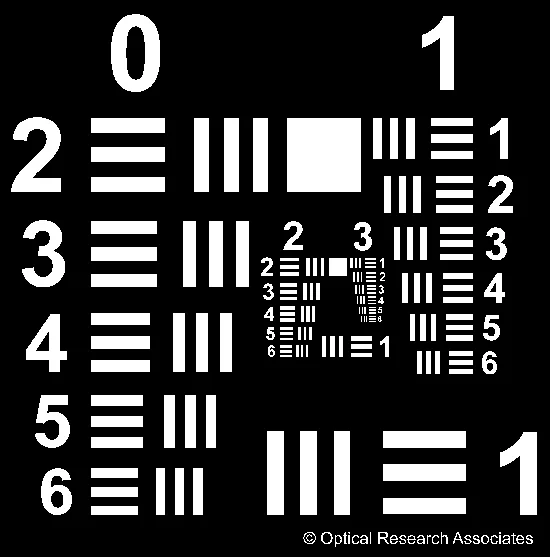
In practice, test patterns such as the 1951 USAF resolution target or Ronchi rulings are used to evaluate an optical system’s resolution. These patterns consist of alternating black and white bars, which highlight the system’s ability to produce sharp, detailed images. High-resolution optics deliver clear, detailed images with minimal blurring, as shown in Figure 1, while low-resolution optics struggle to retain such fine detail.

One way to conceptualize resolution is to compare it to pixels on a camera sensor. Each line-pair corresponds to two pixels—one for the black line and one for the adjacent white line. Therefore, the resolution of a camera can be expressed as twice the pixel size (Figure 2).
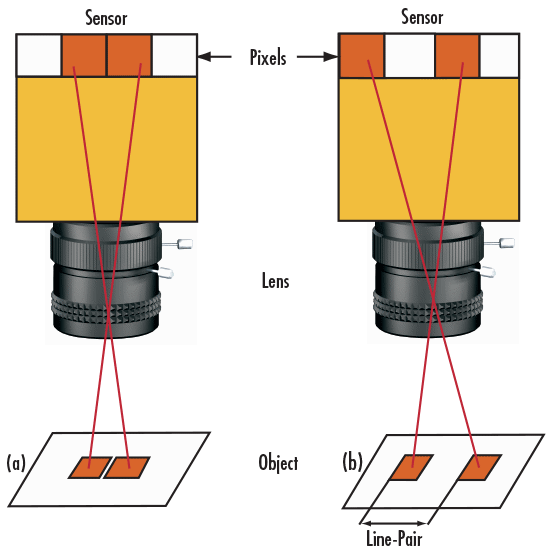
The resolution of an object, on the other hand, can be derived by incorporating the magnification of the imaging lens (Equations 1–2). These calculations assume that the lens itself introduces no loss of resolution.
\[\tag{1}\text{Object Resolution}\left[\mu\text{m}\right]=\frac{\text{Camera Resolution}\left[\mu\text{m}\right]}{\text{PMAG}}\]
\[\tag{2}\text{Object Resolution}\left[\frac{\text{lp}}{\text{mm}}\right]=\text{PMAG}\times\text{Camera Resolution}\left[\frac{\text{lp}}{\text{mm}}\right]\]
Contrast/Modulation
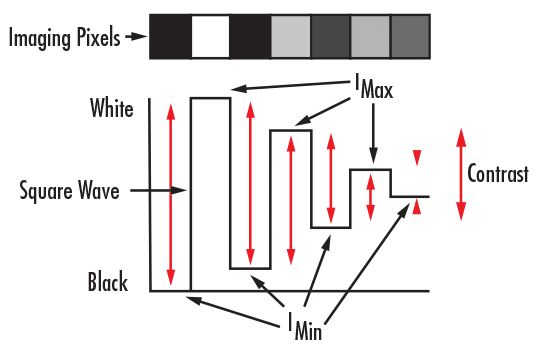
Contrast measures how well an optical system maintains the difference between light and dark areas when transferring an image from the object plane to the image plane. Imagine a bar pattern with maximum intensity for the white bars and zero intensity for the black bars. The resulting intensity distribution resembles a square wave (Figure 3), and contrast is calculated using Equation 3.
\[\tag{3}\%\text{Contrast}=\left[\frac{I_\text{max}-I_\text{min}}{I_\text{max}+I_\text{min}}\right]\]
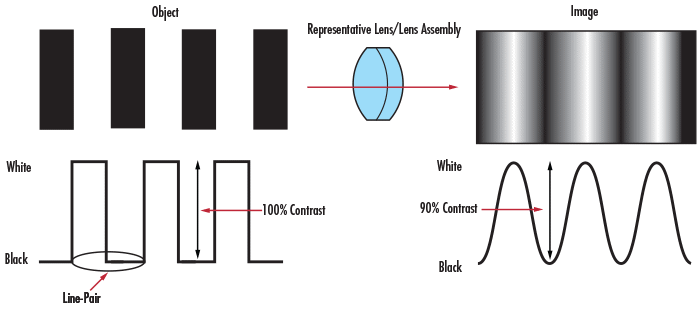
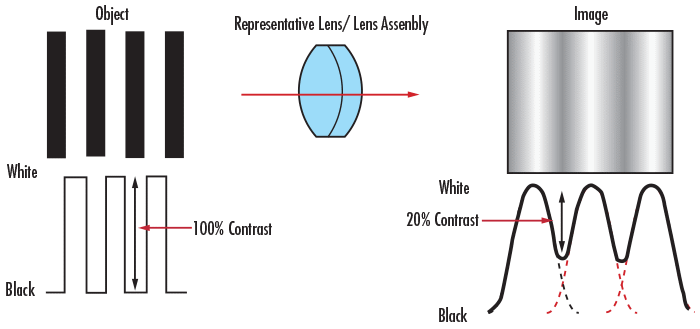
As shown in Figure 4, the imaging process causes a decrease in contrast, which is most noticeable at higher spatial frequencies (i.e., closer line-pairs). This effect is demonstrated in Figure 5, where the contrast diminishes as the frequency of the lines increases. For an optical system to deliver clear and distinguishable images, it must minimize this loss of contrast. Factors such as the lens, sensor, and illumination all influence the resulting contrast.
EXPLORING THE MODULATION TRANSFER FUNCTION (MTF)
The modulation transfer function quantifies how effectively a lens transfers contrast at a specific resolution. By combining resolution and contrast into a single metric, MTF provides a clear picture of an optical system’s imaging performance.
As the spacing between lines on a test target decreases (or frequency increases), the lens struggles to maintain contrast, causing the MTF to drop. In ideal, aberration-free systems with circular pupils, the MTF can be calculated using Equation 4, which expresses MTF as a function of spatial resolution (ξ). The cut-off frequency (ξc), where the lens can no longer resolve details, is defined by Equation 6. Figure 6 illustrates how MTF decreases with increasing spatial resolution, even in these idealized conditions.
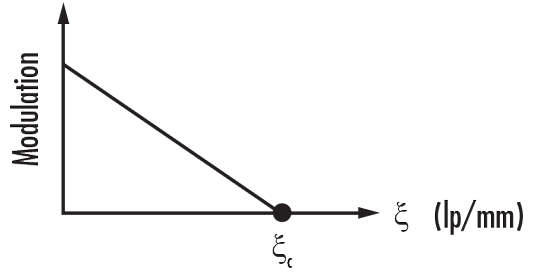
\[\tag{4}\text{MTF}(\xi)=\frac{2}{\pi}(\varphi-\cos\varphi\cdot\sin\varphi)\]
\[\tag{5}\varphi=\cos^{-1}\left(\frac{\xi}{\xi_\text{c}}\right)\]
\[\tag{6}\xi_\text{c}=\frac{1}{\lambda\cdot(f/\#)}\]
THE ROLE OF MTF IN SYSTEM PERFORMANCE
In many applications, the weakest link principle is used to estimate system performance, where the component with the lowest resolution is assumed to dictate overall image quality. While this approach provides a quick estimate, it oversimplifies the reality that all components introduce their own errors, which combine to degrade image quality.
Every part of an optical system, from the lens to the sensor and even cables, has its own MTF curve. The overall system MTF is the product of these individual curves (Figure 7). Understanding these contributions enables designers to evaluate and optimize system performance for specific applications. For example, comparing two 25mm lenses with a Sony monochrome camera allows designers to determine the better choice based on their combined MTF curves and the application’s resolution requirements.

CHARACTERIZING MTF IN PRACTICE
Measuring Real-World MTF
While theoretical MTF curves are derived from a lens’s optical design, real-world performance can deviate due to manufacturing tolerances. Factors like lens geometry and coating imperfections can cause small reductions in MTF. To address this, Notch Optics employs state-of-the-art optical testing equipment to measure the actual MTF of lenses. This ensures accurate performance data, even for commercial lenses where design details may not be disclosed.
Reading MTF Data
An MTF graph plots contrast transfer as a function of spatial frequency (cycles/mm). Some key points to consider when analyzing these graphs include:
- MTF curves are typically calculated for specific field positions, such as on-axis, 70% field, and full-field. The 70% field point is a common reference because it represents about half the total imaging area.
- Off-axis MTF data often includes tangential and sagittal orientations, denoted as “T” and “S” curves.
- Parameters like system conjugates, wavebands, and f/# influence MTF curves. It’s important to ensure these conditions align with the intended application.
Nominal MTF curves, which represent best-case scenarios, are calculated using ideal design data without accounting for manufacturing tolerances.
PRACTICAL APPLICATIONS OF MTF
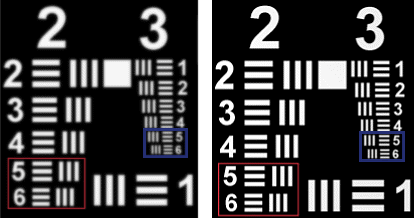
To see MTF in action, consider the comparison of two lenses resolving elements on a 1951 USAF resolution target. As shown in Figures 8–12, the lens with the higher MTF curve performs better at resolving fine details, resulting in sharper images at higher spatial frequencies. However, the optimal choice of lens depends on the specific application; some lenses are designed to excel at lower spatial frequencies.



CONCLUSION
The modulation transfer function (MTF) is a critical metric for assessing optical performance, combining resolution and contrast into a unified measure. By understanding MTF, optical designers can make informed decisions to select components that meet specific imaging requirements. With its advanced testing and measurement capabilities, Notch Optics ensures lenses and optical systems deliver precise, reliable results, empowering designers to succeed in demanding applications.
