Surface roughness describes the small deviations from an ideal surface, with higher values indicating rougher surfaces and lower values indicating smoother ones. Roughness represents high spatial frequency errors, referring to very small deviations on the order of angstroms (10⁻¹⁰ m).
Understanding surface roughness is essential in optical applications to control light scatter, as scatter often correlates with the surface roughness of optics. Light scattering and absorption from rough surfaces significantly impact high-power laser systems, potentially reducing efficiency and lowering the laser damage threshold.
Additionally, scattered laser radiation poses a safety hazard as it may be directed in unintended directions. The current standard for surface roughness is ISO 10110-8, which specifies how surface roughness should be analyzed and documented.
Reading Surface Roughness Callouts
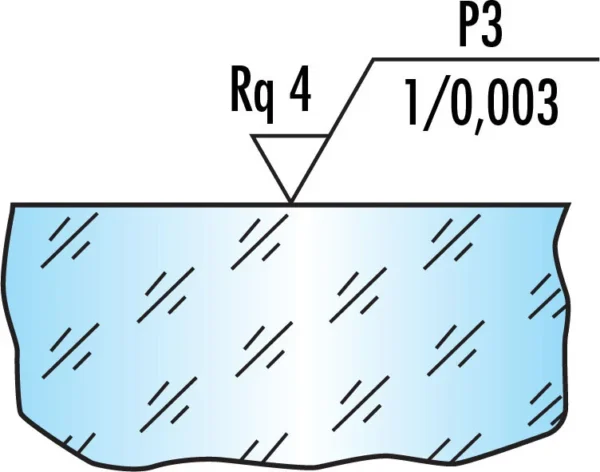
An ISO 10110-8 compliant drawing specifies several characteristics to describe an optical surface:
- Surface Finish (e.g., “P3”): This variable indicates the surface finish. For simple polishing specifications, “G” denotes a ground surface, and “P” denotes an optically polished surface. The polish grade is assigned from 1 to 4, based on microdefects per 10mm scan, as shown in Table 1.
- Statistical Method (e.g., “Rq 4”): This indicates the statistical method for measuring surface roughness and its value.
- Spatial Bandwidth (e.g., “1/0.003”): This specifies the spatial bandwidth range from the upper bound to the lower bound.

Spatial Frequencies and Frequency Groups
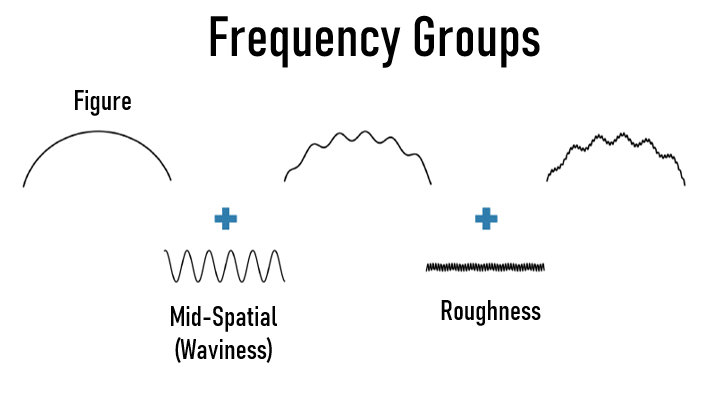
Quantifying surface texture requires specifying the spatial resolution level. Surface texture, or the complete surface shape, is categorized into three spatial frequency groups: roughness, waviness, and figure.
Figure 2 illustrates how figure, waviness, and roughness define surface deviation from an ideal shape. Figure represents large-scale shape deviations (on the order of tenths of mm to cm), waviness measures mid-spatial frequency errors (µm to mm), and roughness is the smallest form of error (tenths of angstroms to tens of µm).
ISO 10110-8 Surface Roughness Parameters
ISO 10110-8 defines rules for surface texture specification. As per ISO, “surface texture is a characteristic of a surface that can be effectively described with statistical methods.” The standard includes five statistical methods to characterize optically smooth surfaces, which can be used in combination across different spatial bandwidths. If no spatial frequency is specified, ISO 10110-8 assumes a range of 0.0025mm – 0.08mm.
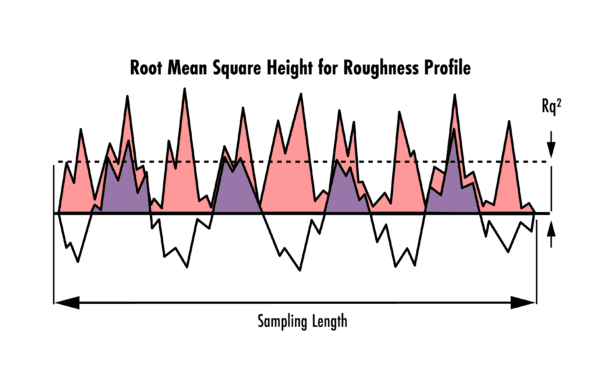
- RMS Roughness and Waviness: RMS (root mean square) roughness is commonly used to specify optically smooth surfaces in the United States, while absolute roughness is more common in Europe. RMS roughness (Rq) measures the roughness profile, and RMS waviness (Wq) measures the waviness profile over different spatial frequencies.
\[\begin{align}\{R_q,W_q\}&\in{T}\\T&=\displaystyle\sqrt{\frac{1}{l_r}\int_0^{l_r}Z^2(x)\text{d}x}\end{align}\]
where:
\(R_q\): Surface roughness (root mean square deviation)
\(W_q\): Surface waviness (root mean square deviation)
\(T\): Generalized surface texture (roughness or waviness; root mean square deviation)
\(l_r\): Sample length
\(Z(x)\): Surface profile along the x-axis - RMS Slope: This specification measures the RMS slope of the local tilt \(\frac{\text{d}Z(x)}{\text{d}x}\) along a given sampling length.
\[\begin{align}\Delta{T}&=\displaystyle\sqrt{\frac{1}{l_r}\int_0^{l_r}\left[\frac{\text{d}Z(x)}{\text{d}x}\right]^2\text{d}x}\\\displaystyle\begin{pmatrix}T\\T\Delta{q}\end{pmatrix}&=\begin{cases}\begin{pmatrix}R_q\\R\Delta{q}\end{pmatrix}\text{ for }1\text{Å}\le{l_r}\le1\text{µm}\\\begin{pmatrix}W_q\\W\Delta{q}\end{pmatrix}\text{ for }1\text{µm}\le{l_r}\le1\text{mm}\end{cases}\end{align}\]
where:
\(R\Delta{q}\): Surface roughness slope (root mean square slope)
\(W\Delta{q}\): Surface waviness slope (root mean square slope) - Microdefect Density: Microdefects (pits and scratches) are quantified using profilometers, microscopes, or image comparators. ISO 10110-8 specifies that “the number of microdefects, N, is counted over a 10mm line scan with a 3µm resolution or a 300µm × 300µm area with the same resolution.”
- Power Spectral Density (PSD) Function: PSD provides a comprehensive statistical analysis of surface roughness, characterizing the relative strength of each roughness component based on spatial frequency.
\[\text{PSD}(f_x,f_y)=\lim_{L\rightarrow\infty}\frac{1}{L^2}\displaystyle\left|\int_{-L/2}^{L/2}\int_{-L/2}^{L/2}z(x,y)\exp[-2\pi{j}(f_xx+f_yy)]\text{d}x\text{d}y\right|\]
This is the general equation used to calculate the PSD of a 2-dimensional surface. \(f_x\) and \(f_y\) are the spatial frequencies of the surface texture \(z(x,y)\), which is defined over a square area of side length, \(L\).
Metrology for Measuring Surface Roughness
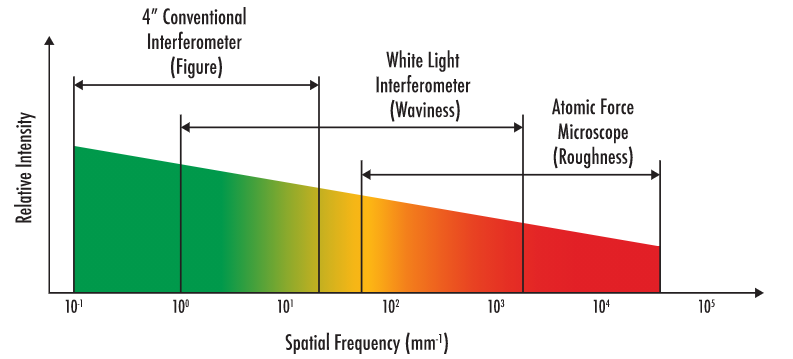
Different metrology technologies are suited for specific spatial frequencies, including conventional interferometry, white light interferometry, and atomic force microscopy. Conventional interferometry measures low spatial frequency errors, often referred to as figure errors and associated with Zernike polynomials.
White light interferometry is ideal for measuring mid-range spatial frequencies, or waviness, which can cause hazing and reduce contrast. Atomic force microscopy (AFM) offers the best resolution for high-frequency spatial errors, characterizing the optical surface roughness.
Both white light interferometry and AFM can measure roughness, with equipment selection often depending on the application wavelength. WLI, for instance, is effective in measuring visible and IR spectra at frequencies below 2,000 cycles/mm.
Specifying Surface Quality for Ultrafast Optics
For ultrafast optics, manufacturers use discretion to specify surface quality, as there is no established standard. Some manufacturers specify only pre-coating surface quality, while others may quote post-coating quality at a standard of 20-10 or higher.
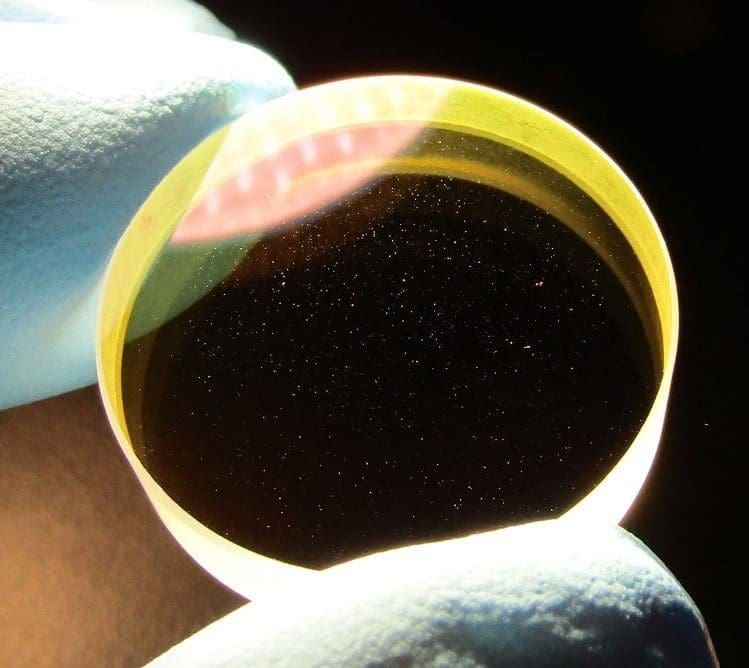
Ultrafast optics typically feature thick, specialized coatings applied through lengthy sputtering processes. Minor imperfections, appearing as “dust” or irregular surface qualities, can result from small surges in sputtering material flow during this process.
These imperfections have negligible effects on the optic’s overall performance, as they are too small to significantly impact bulk film properties like group delay dispersion and reflectivity. However, applications requiring very small beam sizes or ultra-low loss may experience an increase in scattering due to these imperfections. To meet stricter specifications, using a super-polished substrate can help reduce scatter.
Metrology at Notch Optics
Accurate measurement is a cornerstone of manufacturing at Notch Optics. A comprehensive global quality program ensures that each component meets specified requirements.
Notch Optics employs a range of metrology equipment—including interferometers, profilometers, coordinate measurement machines (CMMs), and various optical and mechanical devices—to conduct in-house testing, measuring surface roughness and other optical properties.
