Fluorescence is a molecular phenomenon where a substance absorbs light of one color and almost instantaneously emits light of another color, typically at a lower energy and therefore a longer wavelength. This process, known as excitation and emission, is exhibited by many organic and inorganic substances. In the early days of fluorescence microscopy, microscopists observed primary, or autofluorescence, in samples.
However, today, numerous dyes with intense fluorescence have been developed for selectively staining specific parts of a specimen, a method known as secondary or indirect fluorescence. These dyes are called fluorochromes, and when conjugated to biologically active substances like antibodies or nucleic acids, they are known as fluorescent probes or fluorophores (terms often used interchangeably).
Now, fluorochromes are available with peak emissions across the spectrum, including near-infrared, as well as blue, green, orange, and red wavelengths. In microscopy, when using indirect fluorescence with fluorochromes, sample autofluorescence is generally considered undesirable, as it often constitutes the primary source of unwanted light in the image.
Excitation and Emission Spectra
Figure 1 displays a typical excitation and emission spectrum for a fluorochrome. These spectra are produced using a spectrofluorimeter, an instrument that consists of two spectrometers: one for illumination and one for analysis. First, the dye sample is intensely illuminated with a color known to induce fluorescence. A fluorescent emission spectrum is then generated by scanning with the analyzing spectrometer while maintaining the illumination color. Next, the analyzer is fixed at the peak emission color, and the excitation spectrum is recorded by scanning with the illuminating spectrometer, measuring how emission intensity varies at this fixed wavelength. For filter design purposes, these spectra are normalized to a relative intensity scale.
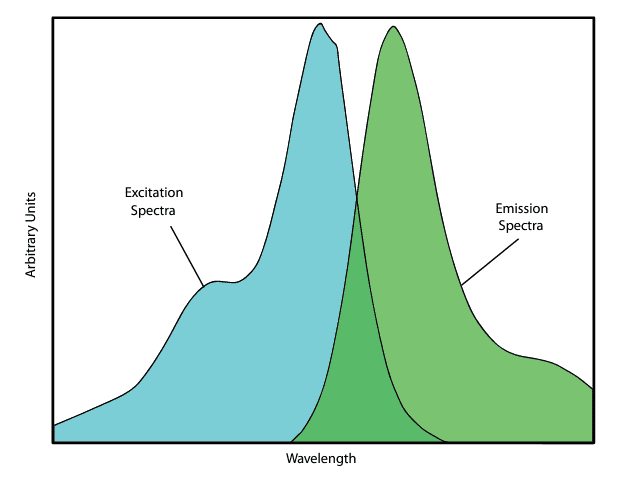
These color spectra are quantitatively described by the light’s wavelength, typically measured in nanometers (nm) for fluorescence spectra. The visible spectrum’s colors can be approximately divided by wavelength ranges (see Figure 2):
- Violet and Indigo: 400 to 450 nm
- Blue and Aqua: 450 to 500 nm
- Green: 500 to 570 nm
- Yellow and Orange: 570 to 610 nm
- Red: 610 to approximately 750 nm
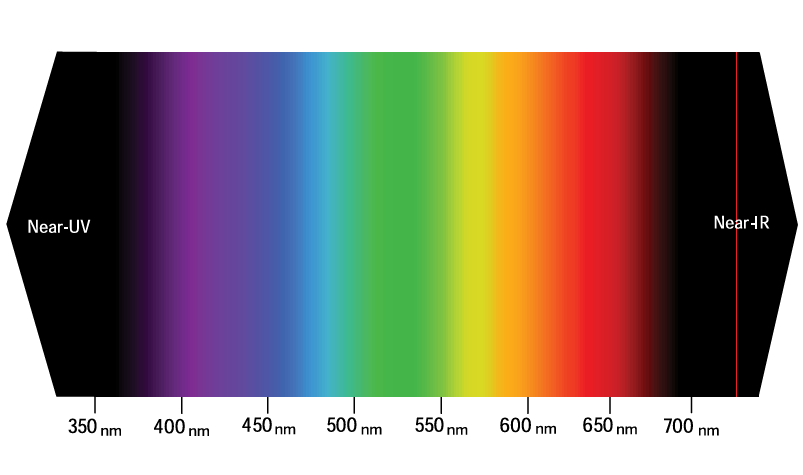
On the short-wavelength end of the visible spectrum lies the near-ultraviolet (near-UV) band, spanning from 320 to 400 nm, while the long-wavelength end is defined by the near-infrared (near-IR) band, from 750 to approximately 2500 nm.
Together, the 320–2500 nm range marks the transparency limits of crown glass and window glass and is the primary band used in fluorescence microscopy. Some applications, particularly in organic chemistry, use excitation light in the mid-ultraviolet band (190 to 320 nm), which requires special UV-transparent illumination optics.
Fluorescence spectra have several key characteristics relevant to fluorescence microscopy and filter design:
- While some substances exhibit broad excitation and emission spectra, most fluorochromes have well-defined excitation and emission bands. The gap between the peaks of these bands is known as the Stokes shift (see Figure 1 for a typical example).
- Although emission intensity changes with excitation wavelength, the spectral distribution of emitted light remains largely consistent regardless of the excitation wavelength.
- Excitation and emission of a fluorochrome may shift due to changes in the cellular environment, including pH levels, dye concentration, or conjugation to other molecules. Some dyes, such as FURA-2 and Indo-1, are particularly useful because their excitation or emission spectra shift significantly with variations in ion concentrations (e.g., H⁺ for pH, Ca²⁺, Na⁺).
- Lastly, photochemical reactions can reduce a dye’s fluorescence efficiency over time, an effect known as photobleaching or fading.
Brightness of the Fluorescence Signal
Several factors determine the amount of fluorescence emitted by a stained specimen under a given excitation intensity:
- Dye Concentration and Specimen Thickness: The concentration of dye in stained areas and the thickness of the specimen both impact fluorescence intensity.
- Extinction Coefficient of the Dye: This coefficient indicates how much incident light is absorbed based on dye concentration and specimen thickness, reflecting the wavelength-dependent absorption shown in the excitation spectrum of the fluorochrome.
- Quantum Efficiency of the Dye: The efficiency with which the dye converts absorbed light into fluorescence affects signal brightness.
- Amount of Stained Material in the Field of View: The quantity of stained material within the microscope’s field of view also influences fluorescence intensity.
While many fluorochromes exhibit high extinction coefficients at peak excitation wavelengths, practical limitations in sample preparation often restrict the maximum dye concentration, reducing the total light absorbed by the stained specimen.
Quantum Efficiency and Signal Intensity in Fluorescence Microscopy
Quantum efficiency, defined as the ratio of light energy absorbed to fluorescence emitted, indicates how effectively absorbed light is converted into fluorescence. Common fluorochromes have a quantum efficiency of around 0.3, although this efficiency can be reduced by quenching processes, such as photobleaching.
Combined with the fact that many specimens contain only trace amounts of stained material within the observed field, the resulting ratio of emitted fluorescence intensity to excitation light intensity in typical applications ranges from approximately 10⁻⁴ (for highly fluorescent samples) to 10⁻⁶.
Techniques such as fluorescence in situ hybridization (FISH), which use very small amounts of fluorescent material, may exhibit even lower ratios, down to 10⁻⁹ or 10⁻¹⁰.
To visualize these weak fluorescence signals with sufficient contrast, the fluorescence microscope must be able to attenuate the excitation light by as much as 10⁻¹¹ without reducing the fluorescence signal. This balance is achieved not only through the use of optical filters but also through the inherent design of the fluorescence microscope, which significantly enhances the filtering process.
The Fluorescence Microscope
Figure 3 shows a schematic of a typical epifluorescence microscope, which uses incident (episcopic) illumination. This is the most widely used type of fluorescence microscope. Its key feature is that, by using incident light, it only needs to filter out excitation light that scatters back from the specimen or reflects off glass surfaces.
High-quality oil-immersion objectives, constructed from materials with minimal autofluorescence and used with low-fluorescence oil, help to eliminate surface reflections, reducing back-scattered light to as little as 1/100 of the incident light.
Additionally, the dichroic beamsplitter, which reflects excitation light into the objective, provides further filtering of back-scattered excitation light, attenuating it by another factor of 10 to 500. (The design and function of these beamsplitters are discussed below.)
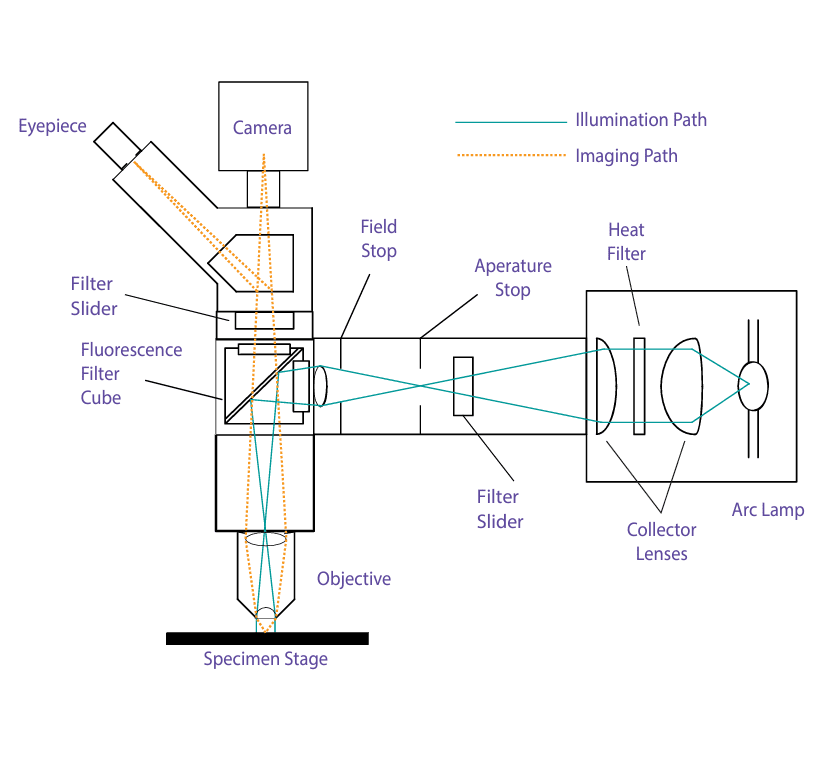
An epifluorescence microscope with oil immersion, using only a high-quality dichroic beamsplitter, can reduce observable excitation light relative to observed fluorescence by factors ranging from 1 (for very bright fluorescence) to as much as 10⁵ or 10⁶ (for very weak fluorescence).
To achieve a background that is, for instance, one-tenth of the fluorescence image, additional filters are required to attenuate the observed excitation light by as much as 10⁻⁶ or 10⁻⁷ for weakly fluorescing specimens, while still transmitting nearly all available fluorescence.
Fortunately, advanced filter technologies are available that meet these rigorous demands.
Types of Filters Used in Fluorescence Microscopy
The primary filtering components in an epifluorescence microscope are the three filters housed within the fluorescence filter cube (also called the filter block): the excitation filter, the emission filter, and the dichroic beamsplitter. Figure 4 provides a schematic illustration of a typical filter cube.
- Excitation Filter (Exciter)
The excitation filter transmits only those illumination wavelengths that efficiently excite a specific dye. Filter blocks are commonly named according to the type of excitation filter they use:- UV: Ultraviolet excitation for dyes such as DAPI and Hoechst 33342.
- B (Blue): Blue excitation for FITC and similar dyes.
- G (Green): Green excitation for TRITC, Texas Red®, etc.
- Emission Filter (Barrier Filter or Emitter)
The emission filter blocks all light transmitted by the excitation filter while efficiently allowing any fluorescence emitted by the specimen to pass through. This emitted fluorescence always has a longer wavelength (shifted toward the red) compared to the excitation light. Emission filters can be either bandpass or longpass filters. Common barrier filter colors include:- Blue or pale yellow for the U-block.
- Green or deep yellow for the B-block.
- Orange or red for the G-block.
- Dichroic Beamsplitter (Dichroic Mirror or Dichromatic Beamsplitter)
The dichroic beamsplitter is a thin piece of specially coated glass set at a 45-degree angle to the microscope’s optical path. Its coating uniquely reflects one color (the excitation light) while transmitting a different color (the emitted fluorescence). Modern dichroic beamsplitters are highly efficient, reflecting more than 95% of the excitation light and transmitting approximately 95% of the emission, significantly outperforming traditional gray half-silvered mirrors that offered only about 25% efficiency (50% reflectivity and 50% transmission). The glass substrate is typically composed of low-autofluorescence materials, such as UV-grade fused silica.
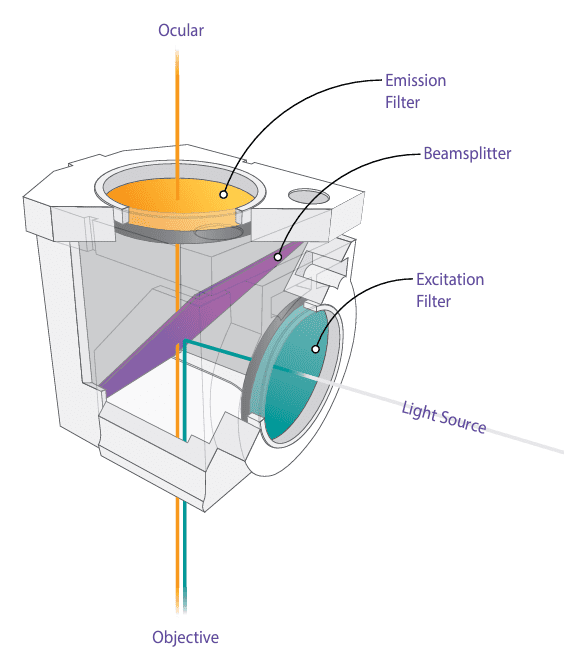
Most microscopes feature a slider or turret capable of holding two to four individual filter cubes. It’s important to note that each cube contains a matched set of filters, and mixing filters and beamsplitters is discouraged unless the full spectral characteristics of each filter component are known.
Additional optical filters are commonly found in fluorescence microscopes:
- Heat Filter (Hot Mirror): Integrated into the illuminator’s collector optics in most microscopes, this filter attenuates infrared light (typically wavelengths above 800 nm) while transmitting most visible light.
- Neutral-Density Filters: Usually positioned in a filter slider or wheel between the collector and the aperture diaphragm, these filters control illumination intensity.
- Other Technique-Specific Filters: Filters for non-fluorescence techniques, such as color filters for transmitted-light microscopy and linear polarizing filters for polarized light microscopy, may also be installed in the microscope setup.
The Evolution of the Fluorescence Microscope
The basic configuration of the modern fluorescence microscope has developed over nearly 100 years of innovation. By examining its evolution, one gains insight into the function of its various components.
Early Fluorescence Microscopy
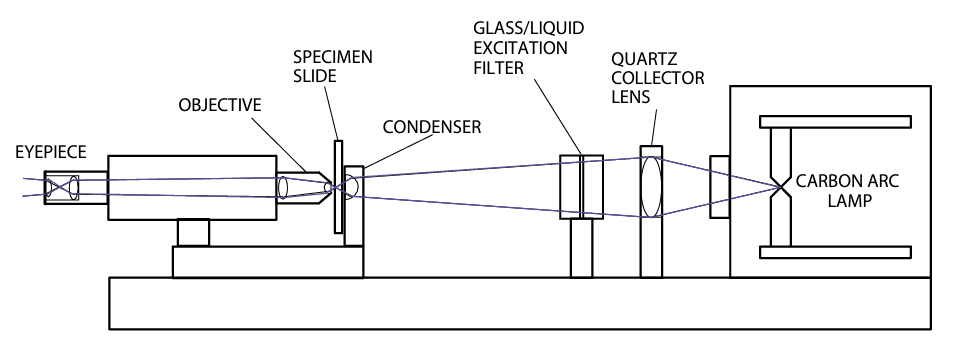
The first fluorescence microscopes achieved adequate separation of excitation and emission light by exciting specimens with invisible ultraviolet (UV) light, which reduced the need for barrier filters. One early 20th-century microscope used a 2000 W iron arc lamp, which was both bulky and hazardous.
This light source was filtered through a combination of Wood’s solution (a nitrosodimethylaniline dye) in gelatin, a liquid copper sulfate chamber, and blue-violet filter glass. This initial excitation filter generated a broad band of near-UV light with minimal visible light, allowing microscopists to observe primary fluorescence in specimens.
Early microscopists benefited from the fact that many substances fluoresce when exposed to UV light. In 1914, fluorochromes were introduced for selective staining of cell structures, marking the first use of secondary fluorescence in microscopy.
These early fluorescence microscopes, depicted schematically in Figure 5, employed diascopic (transmitted light) illumination. Both brightfield and darkfield oil-immersion condensers were used, each with notable drawbacks.
With the brightfield condenser, illumination intensity was limited by the optical filters available at the time, which restricted the microscope’s overall brightness. In contrast, the darkfield condenser directed excitation light into a cone at oblique angles, preventing most of it from entering the objective lens and thereby reducing the filtering requirements.
However, this method significantly decreased illumination efficiency. Additionally, the objective lens needed a smaller numerical aperture, further diminishing brightness and lowering resolution.
The most significant advancement in fluorescence microscopy was the introduction of episcopic (incident) illumination in 1929. Initially developed for observing fluorescence in bulk and opaque specimens, these early epifluorescence microscopes likely used half-silvered mirrors as beamsplitters, yielding a maximum efficiency of around 25%. However, episcopic illumination offered key advantages:
- Higher Brightness: The high numerical aperture objective could be used as the condenser, enhancing brightness.
- Reduced Back-Reflected Excitation Light: Only about 1% of the incident excitation light reflects back into an oil-immersion objective.
- Ease of Alignment: Alignment was simplified compared to earlier systems.
In 1948, E. M. Brumberg introduced dichroic mirrors for ultraviolet excitation, and J. S. Ploem further refined them in the 1960s for visible light excitation, boosting beamsplitter efficiency to nearly 100% and significantly improving filtering capabilities.
Ploem also introduced narrowband interference filters for blue and green excitation and developed the filter cube, allowing easy swapping of filters and beamsplitters for different fluorochromes. These advancements spurred the commercialization of the epifluorescence microscope.
Other crucial technical developments of this era included:
- Compact Mercury-Vapor and Xenon Arc Lamps (1935): These offered powerful light sources for fluorescence microscopy.
- Enhanced Colored Filter Glasses: This enabled the use of fluorochromes excited by visible light, allowing for simpler tungsten filament light sources.
- Improvements in Objective Lens Design: Advances in lens technology enhanced image clarity and resolution.
- Anti-Reflection Coatings for Microscope Optics (circa 1940): These coatings reduced light loss and improved optical efficiency.
Together, these innovations laid the foundation for modern fluorescence microscopy.
Recent technological advancements have allowed fluorescence microscopy to evolve alongside the rapid progress in biological and biomedical sciences. Key innovations include ultrasensitive cameras, laser-based illumination, confocal and multi-photon microscopy, digital image processing, new fluorochromes and fluorescent probes, and substantial improvements in optical filters and beamsplitters.
